The Beer Game: Why Steady Demand Still Wrecks Your Supply Chain
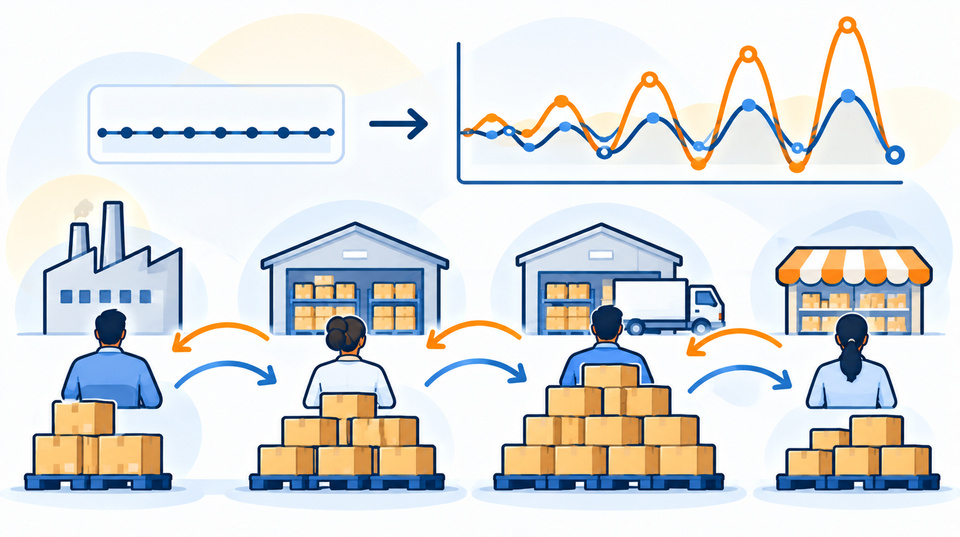
Consumer demand changes once. It goes from 4 cases a week to 8, and it stays there for the rest of the game.
By the time that signal reaches the factory, it is ordering 37 cases a week. A few months later it is ordering nothing at all, because every warehouse in the chain is full.
Nobody in the chain did anything stupid. Every person made a sensible call with the information in front of them. That is what makes the Beer Game so uncomfortable, and so useful.
Play the Beer Game here. It takes about ten minutes. Then come back and see how you compare.
What the Beer Game is
The Beer Distribution Game came out of MIT in the 1960s, from Jay Forrester's system dynamics group. It has been run in business schools and planning teams ever since, and it still catches experienced people out.
The setup is simple. Four companies sit in a line: a retailer, a wholesaler, a distributor and a factory. Each week, every player does three things:
- Receives cases from their supplier
- Ships cases to their customer, if they have them
- Places an order with their supplier
There are delays everywhere. An order takes two weeks to reach your supplier, and the cases take two more weeks to reach you. The factory takes a few weeks to brew. So anything you order today shows up about a month later.
Costs keep score. Every case sitting in stock costs $0.50 a week. Every case you owe a customer and cannot ship costs $1.00 a week. Running out is twice as expensive as holding stock, which pushes everyone towards caution.
The last rule is the one that matters most. Players cannot talk to each other. You see your own stock and the orders arriving from your customer. That is all.
What happens when people play it
In my online version, you play one tier and the other three are run by bots. The bots use the ordering rule John Sterman measured in real players in his well-known 1989 study, so they behave like a typical human team.
Here is what a typical team does over 36 weeks:
| Tier | Largest weekly order | Times bigger than real demand |
|---|---|---|
| Consumers | 8 | 1.0 |
| Retailer | 11 | 1.4 |
| Wholesaler | 18 | 2.3 |
| Distributor | 28 | 3.5 |
| Factory | 37 | 4.6 |
Each step up the chain makes the swing bigger. That is the bullwhip effect. A small flick at the handle becomes a big crack at the tip.
The cost tells the same story. A typical team spends about $3,300 over 36 weeks. A team that simply passes each order straight upstream, with no adjustment at all, spends about $1,100. Doing nothing clever beats the typical team by two thirds.
Sterman found the same thing with real players. The average team's costs were many times the benchmark, and almost every team blamed the customer for being unpredictable. The customer changed once.
Why it happens
People forget what is already on order
This is the big one. Sterman's research showed that players react to the shortage in front of them and largely ignore the stock already in the pipeline.
So in week 7 you are short. You order more. In week 8 you are still short, because last week's order has not arrived. You order more again. By week 12 all of those orders land at once, and you are drowning in stock.
If you have ever seen a planner raise orders three weeks in a row to cover the same gap, you have seen this in real life.
Delays turn small corrections into big ones
When every decision takes a month to show up, every correction is late. Late corrections need to be bigger. Bigger corrections overshoot. The longer the lead time, the worse this gets.
Each tier only sees the tier below it
The factory never sees a consumer. It sees the distributor's orders, which are a reaction to the wholesaler's orders, which are a reaction to the retailer's. By the time demand reaches the factory, it has been distorted three times.
This is the same pattern Procter & Gamble found with nappies in the 1990s. Babies use nappies at a very steady rate, yet the orders P&G received from distributors swung wildly. That work is where the term "bullwhip effect" took hold in supply chain practice.
This is not just a classroom game
The Beer Game is a simplified chain, but every mechanism in it shows up in real FMCG businesses:
- Promotions create spikes in retailer orders that look like demand but are really forward buying.
- Order batching, such as full-truck minimums or weekly ordering windows, turns smooth demand into lumpy orders.
- Shortage gaming happens when customers expect allocation and over-order to get a bigger share. When supply recovers, the orders vanish.
- Safety stock resets after a disruption, like a pandemic or a bushfire season, push a one-off wave of orders up the chain on top of normal demand.
In each case the factory sees a signal much bigger than the real change in consumption, and plans capacity, materials and labour around it.
Three habits that stop the bullwhip
1. Count the supply line every time you order
Before you place an order, add up what you have on hand, what is on order and not yet arrived, and what you owe customers. Order against that total, not against what is sitting in the warehouse.
How to check: Look at the last time you had a shortage. Did the orders placed in the following weeks add up to more than the gap? If so, the supply line was ignored.
2. Share real demand upstream
The single most effective fix is giving upstream tiers sight of point-of-sale or customer withdrawal data. If the factory can see that consumers went from 4 to 8, it does not need to guess from a distorted order stream.
How to check: Ask your suppliers what data they get from you. If the answer is "your purchase orders", they are playing the Beer Game blind.
3. Shorten the delays you control
You cannot always cut transport lead times, but you can often cut information delays. Weekly ordering instead of fortnightly. Same-day order processing instead of next-day. Every week removed from the loop makes the bullwhip smaller.
How to check: Map the time from a demand change at your customer to the moment it changes your production plan. Count the days spent waiting for a meeting, a report or a cut-off. Those are the easiest days to remove.
Try it yourself
Reading about the bullwhip is one thing. Watching yourself create it is another.
Play the Beer Game as the retailer, wholesaler, distributor or factory. At the end you will see your cost against a typical team, your biggest order, and a chart of exactly where the whip cracked. There is a share button if you want to post your result on LinkedIn.
If you beat the pass-through benchmark, I would genuinely like to hear how you did it.

Member discussion